Chinese
 Spanish
 Russian
 Portuguese
 French
 German
 Indonesian
 Thai
 Vietnamese
 Arabic
 Italian
 Turkish
 Polish
 Japanese


How to Read a Radar Level Echo Curve (And What Each Shape Means)
An echo curve plots reflected signal amplitude against distance. The threshold helps the transmitter decide which echoes are candidates; the selected peak, echo-tracking rules and reference height determine the reported level. Compare peak position with an independent surface reference instead of assuming every threshold crossing is the liquid.
Radar level echo curve: distance, amplitude and threshold
- The horizontal axis normally shows distance from the documented instrument reference. Level is calculated by subtracting that distance from the reference height. An incorrect reference can therefore produce a level error even when the distance trace is stable.
- The vertical axis shows amplitude in decibels or instrument-specific units. Compare the surface echo with the interference and noise within the same instrument rather than comparing amplitude numbers across manufacturers.
- The threshold or TVT curve defines the detection limit over distance. An echo below it may not be selected, even when its position matches the liquid surface.
A useful curve shows the real surface at the correct distance with adequate signal margin over interference and the configured threshold. The meaning of dB, amplitude and signal-quality values varies by manufacturer; use the instrument-specific diagnostics.
Six curve shapes and what they mean
1. Single clean peak
A sharp, stable peak at the verified surface distance indicates a clear reflection. Confirm adequate margin under the expected operating conditions.
2. A second fixed peak just below the antenna
A fixed near-range peak may come from a nozzle, deposit, flange feature or another structure. Compare its distance with the installation drawing and its behavior during level changes. It can interfere with tracking even without becoming the tallest peak, depending on the detection and tracking rules.
Check the antenna and nozzle before applying the manufacturer's suppression procedure. Any nozzle change must also meet the mounting requirements.
3. Several peaks spaced at regular intervals
Regularly spaced peaks can suggest multiple reflections. Compare their distances and movement with the actual surface and vessel geometry before diagnosing them as repeated roof-to-surface paths. Similar spacing alone does not prove the mechanism.
Action: confirm the real surface and use the manufacturer-supported multiple-reflection handling or narrowly targeted suppression. Do not lower gain or raise thresholds indiscriminately.
4. A broad hump instead of a sharp peak
A broad reflection can occur with a distributed or disturbed surface, foam, floating material or overlapping returns. Its width is not a universal indicator of a particular fault. Check the selected target against the required liquid or material surface before deciding whether the reading is usable.
Action: establish which surface is being tracked and compare the error and response against the application requirements. Damping reduces variation, not an incorrect target or systematic offset.
5. No peak above the threshold
A weak or missing detectable surface can follow low reflectivity, excessive distance, near-end restrictions, antenna fouling or severe process attenuation. Check the actual model limits; no single dielectric-constant cutoff applies to all radars.
Inspect the antenna face, then check reflectivity, operating distance and near-range limits before considering a different antenna or measurement method.
6. Two peaks close together that swap dominance
Two nearby peaks that alternate in amplitude can cause the selected distance to jump. Compare their positions with the surface reference, tank internals and conditions such as splashing or mixing.
Record a short trend with the echo curve. Identify any fixed obstruction before applying suppression, and assess relocation if the measuring path remains obstructed.
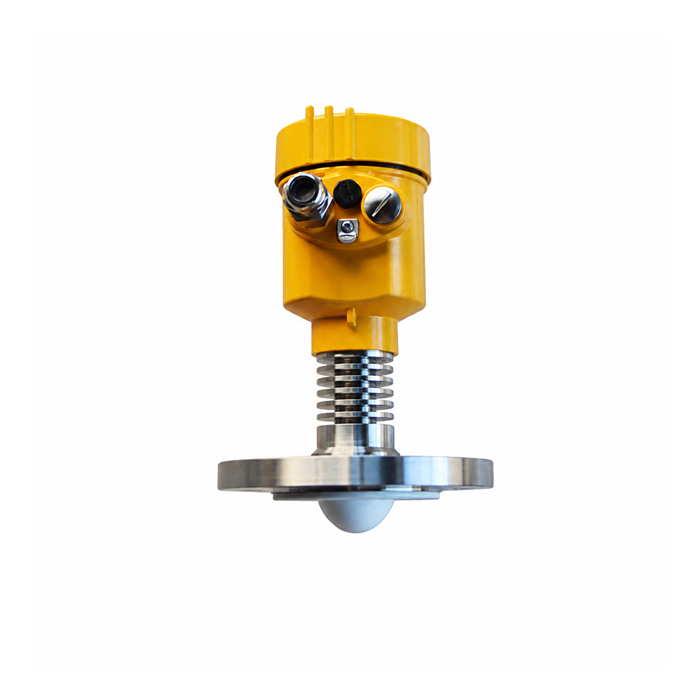
A five-step method for reading any curve
- Locate the independently expected surface distance and identify the echo selected by the instrument. A strong metal obstruction can exceed the true surface echo.
- Convert the selected distance to level using the documented reference height. If it disagrees with an independent level, check both the reference and the selected distance; a wrong target can also produce a stable but incorrect result.
- Record the surface margin over the noise and threshold using the instrument-specific quality metric. Verify sufficient margin during the worst process condition, not only in a quiet tank.
- Scan for fixed peaks. Anything that does not move when the level changes is a candidate for mapping.
- Capture a time series spanning the process event that causes the fault, such as filling, mixing or a condensation cycle. Choose the capture interval to resolve the observed changes. Two scans at an arbitrary fixed interval may miss a short target switch.
Curve shape versus likely cause
| Curve feature | Possible explanation | First check |
|---|---|---|
| Sharp peak, high S/N | May be the surface echo; confirm its distance | Verify target distance and reference before accepting the reading |
| Fixed peak at short distance | Nozzle, antenna deposit or another fixed reflector | Check mounting and deposits; suppress only verified interference |
| Regular multiple peaks | Possible multiple reflections; compare with vessel geometry | Verify target; use approved multiple-reflection handling |
| Broad hump | Foam, turbulence, floating material or overlapping echoes | Verify the tracked surface and error before changing damping |
| No peak | Weak return, near-zone limit, fouling or attenuation | Check model limits, antenna condition and process attenuation |
| Two competing peaks | Competing surface and structural echoes | Identify both reflectors before suppression or relocation |
What the curve cannot tell you
The curve describes the radar signal path. It does not show PLC scaling, reference-height entries or every wiring fault. Compare loop and reference settings when it indicates a stable surface but the control-system value disagrees.
Example patterns in different vessels
Small day tank, 1.5 m: the surface echo should follow changes in level. Check a fixed near-range peak against the nozzle and antenna geometry.
Tall silo, 25 m: compare signal quality during filling and after the material settles. A purge can help keep the antenna clear but may not resolve attenuation through the dust cloud.
In a reactor, the shaft and blades may produce several reflections in addition to the moving surface echo. Record whether the agitator was running when each curve was captured.
Underground sump: at maximum level, compare the shortest surface distance with the model's blocking distance. If the surface enters that region, review the mounting height or instrument selection rather than trying to recover the reading with damping.
Foam may produce a broad reflection or more than one detectable surface. Use an independent liquid-level reference to establish which target the radar follows.
Saving and sharing a curve
Export the curve with its timestamp, indicated distance, level and configuration version. Include threshold and suppression overlays where available, together with the tank drawing and operating state.
FAQ
Q1. Can I read the echo curve without special software?
Access depends on the exact device and ordered interface. Some instruments offer a local diagnostic view; others need a compatible configuration tool. HART or Modbus support alone does not guarantee access to full echo data. Specify the required curve, threshold and suppression export functions before purchase.
Q2. What is a good signal-to-noise ratio?
Use the model-specific diagnostic definition and limits. A value labelled SNR, confidence or signal quality may not be comparable with another device. Confirm that the selected echo follows the independently verified surface during the process conditions that cause problems, rather than accepting one high value from a quiet tank.
Q3. Why does the peak move when nothing in the tank changed?
First confirm that the surface is actually stationary and check which peak the instrument selected. Agitation, a competing reflector or changing deposits can move the tracked distance even when inventory appears unchanged. Capture traces with process timestamps and compare their rate of change with the instrument response and independent observations.
Q4. Does a higher peak always mean a better measurement?
No. An internal metal structure can return a larger signal than the liquid. Check the distance, movement with filling or emptying, and the tracking marker. A large peak at the wrong location is not a valid level measurement, regardless of its margin above the threshold.
Q5. Should I map the tank when it is empty or full?
Follow the instrument-specific suppression procedure and verify the current surface position first. An empty or low-level tank can reveal more obstructions, but the bottom or real surface must not be stored indiscriminately as interference. Keep the original settings and prove tracking through the affected range after any change.
Include the echo curve, threshold overlay, reference height and independently measured level with an echo review request. Send an echo curve for review
Related reading: Radar Level Transmitter Troubleshooting: 9 Faults and How to Fix Them | Radar Level False Echo: Causes, Suppression and When Mapping Fails