Chinese
 Spanish
 Russian
 Portuguese
 French
 German
 Indonesian
 Thai
 Vietnamese
 Arabic
 Italian
 Turkish
 Polish
 Japanese

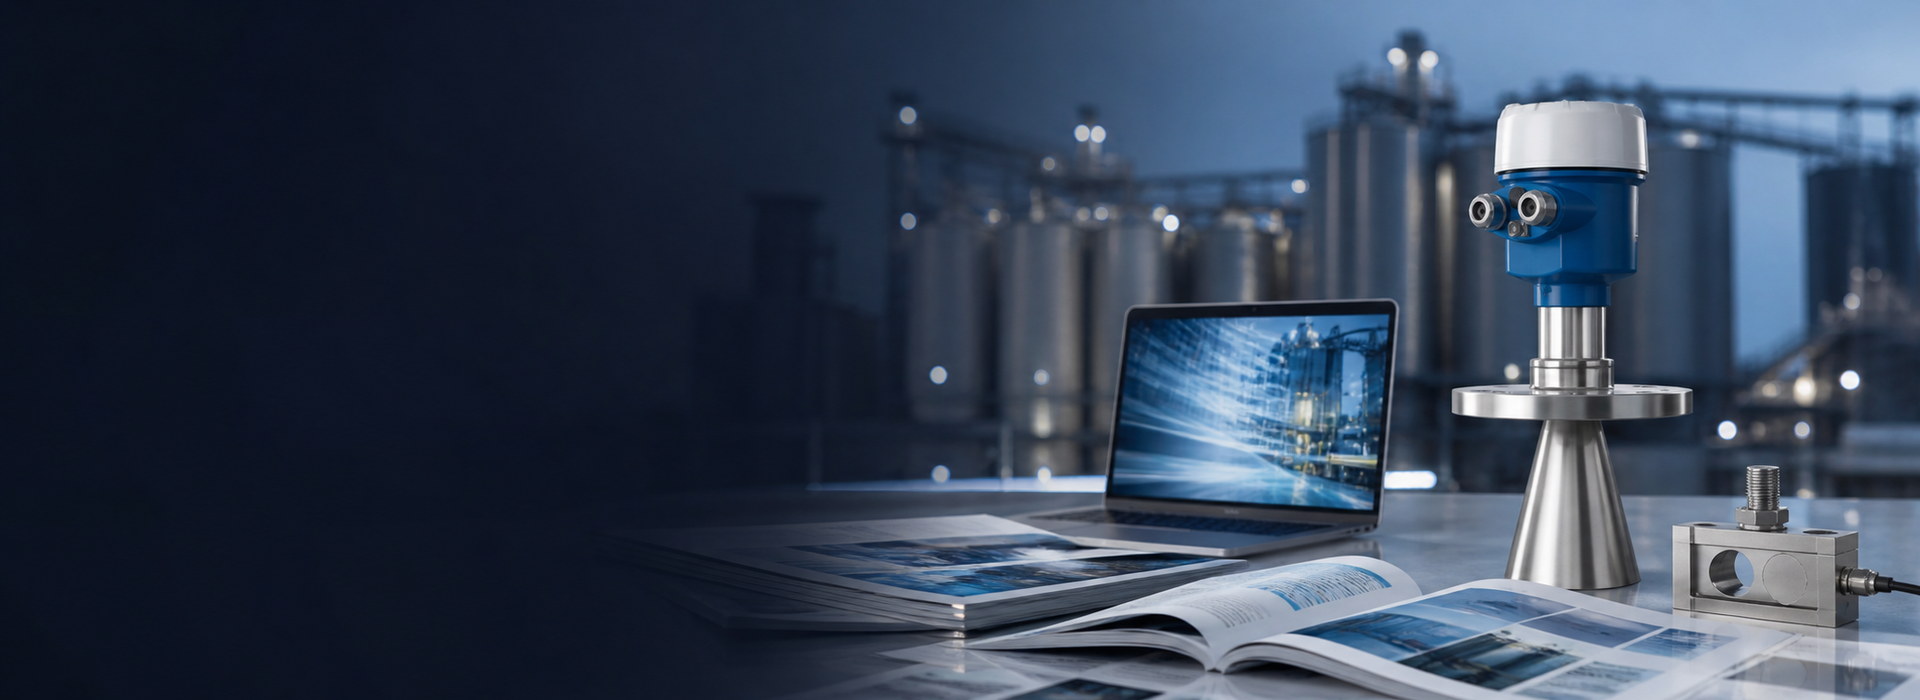
Level Measurement in Foam: When Radar Works and When It Does Not
Radar may detect the liquid below foam, the foam surface, competing echoes or no reliable target. Liquid fraction, conductivity, bubble structure, chemistry and thickness all matter. Wet conductive foam can strongly attenuate the signal, while some dry foams are more transparent; frequency alone does not predict the result.
Classify the foam before choosing an instrument
Foam behaviour varies with its liquid content, chemistry, structure and thickness:
| Foam feature | Possible radar response | Verification |
|---|---|---|
| Thin or open foam | Liquid echo may remain detectable | Compare with independent liquid level |
| Wet or conductive foam | Attenuation, foam-top reflection or echo loss | Test chemistry and worst operating state |
| Dry foam | May be more transmissive, but not always | Check thickness and bubble structure |
| Changing batch foam | Target and offset may change through the cycle | Record trends, curves and reference levels |
| Fouling foam residue | Deposits can affect radar or guided-wave probe | Check cleanability and inspection requirements |
Define whether the process needs liquid level or foam level. Inventory measurement normally requires the liquid surface; a foam-level alarm has a different purpose and acceptance criterion.
What 80 GHz changes, and what it does not
Relevant instrument characteristics include:
- Beam width. Compare the specified antenna angles, not frequency labels. At 10 m, the geometric diameters for full angles of 4, 8 and 10 degrees are about 0.70, 1.40 and 1.75 m. Less overlap with walls may reduce clutter, but does not prove better transmission through foam.
- Resolution. FMCW range resolution depends primarily on sweep bandwidth and signal processing, not carrier wavelength alone. Do not assume that 80 GHz will resolve a 100 mm foam layer from its frequency label.
- Antenna size. Check the ordered lens or horn, connection bore and nozzle length together. A compact antenna can ease installation, but no generic nozzle diameter establishes compatibility or prevents near-range echoes.
The following process limitations remain:
- Transmission through thick foam. If the foam reflects most of the energy, a narrower beam does not get through it.
- Coating. Foam residue on the lens is a mechanical problem.
- Product reflectivity. A weak liquid-surface return may leave less signal margin beneath foam. Check the combined liquid and foam response at the required distance rather than assigning a predictable error from dielectric constant alone.
Select the technology from a test of the actual foam and liquid target rather than from the carrier frequency alone.
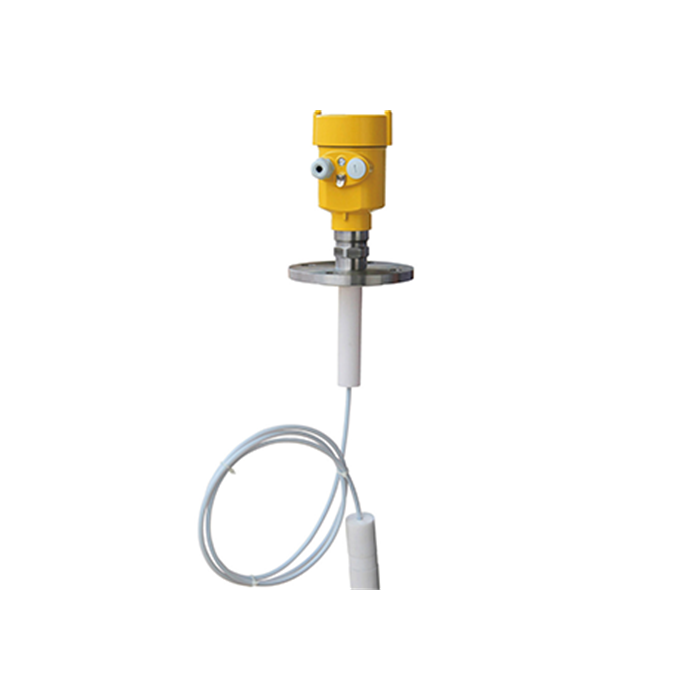
Measurement options for different foam conditions
| Condition | Candidate approach | Limits to verify |
|---|---|---|
| Mild foaming | Suitable non-contact radar | Correct liquid target and adequate margin |
| Severe foaming | Guided-wave probe or other rated method | Foam properties, coating, bridging and probe zones |
| Coating service | Non-contact or probe option selected for deposits | Do not assume a probe is immune to fouling |
| Confined vessel | Focused radar, suitable probe or chamber | Geometry, nozzle and hydraulic response |
| Hygienic vessel | Approved cleanable non-contact or probe design | Materials, CIP/SIP and project certification |
Guided-wave radar as a candidate for difficult foam
A guided-wave probe guides an electromagnetic pulse along a rod or cable, with energy interacting with the surrounding medium. It can improve liquid-surface detection through some foams, but foam properties, probe coating, bridging, process limits and upper/lower transition zones still matter.
For a normally foaming process, compare suitable non-contact radars, guided-wave probes and other rated methods using representative process data or a trial.
Comparing instruments under operating conditions
Where both instruments are available, compare them against the same independent liquid-level reference:
- Fill the vessel to a known level with the foam-generating process running.
- Measure with a free-space radar and record the reading and the echo curve.
- Simultaneously measure with a guided-wave probe, or take a manual measurement through a sight glass.
- Compare each instrument with the same independent liquid reference. A difference correlated with foam depth is evidence to investigate, not proof by itself that one instrument is tracking the foam top; examine the selected echoes and timing as well.
- Repeat at safely accessible levels and during the process stages that produce the most difficult foam. Record any part of the operating range or batch cycle that was not tested.
Include the expected foam conditions and reference method in the application review. Where practical, arrange a site trial before committing to a batch installation.
Installation details that improve foam performance
- Where practical, avoid the foam-generation or inlet zone. Confirm the actual distribution during operation; foam is not necessarily thickest at the same location throughout a batch.
- Check maximum liquid and foam elevations against the antenna position and required clearance. Contact with foam can leave deposits, so assess cleanability and safe maintenance access.
- Provide the model-specific minimum distance and justified installation margin at maximum liquid and foam levels. A small advertised blocking distance does not establish reliable tracking through a rising foam layer.
- Use suitable echo tracking only after verifying the selected surface and maximum allowed delay; configure loss-of-echo and safety responses explicitly.
- If a difference appears, determine whether it changes with foam depth and operating state. Do not treat a changing foam offset as a fixed calibration correction, especially in inventory or safety-related service.
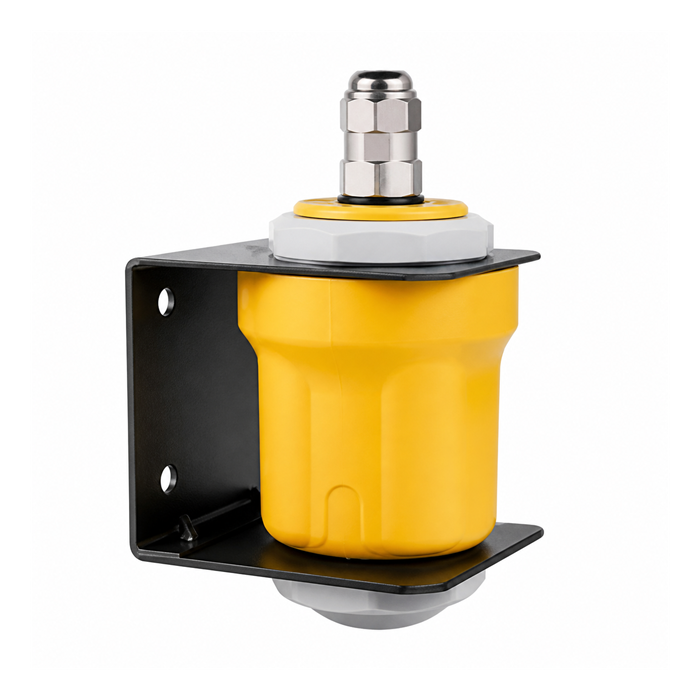
Foam in fermenters and bioreactors
Fermentation foam can change substantially over a batch as gas flow, protein content and process conditions vary. Test the measurement during the stages with the greatest foaming, not only at startup.
Practical approaches:
- For non-contact radar, verify that the intended target remains identifiable throughout the batch and record any change in the difference from the independent liquid level.
- Guided-wave radar, if the probe materials, dielectric properties, fouling risk, cleaning requirements and mechanical arrangement are suitable.
- A separate compatible foam-detection point can signal the presence of foam at its location. It does not identify which surface the radar is following; validate the two measurements and their control actions separately.
Hygienic service does not universally exclude rod probes. Verify the complete sensor design, cleanability, CIP/SIP limits, materials and any required project-specific certification.
Foam in aeration basins and wastewater
Wastewater foam varies with loading, aeration and surfactants. Establish whether the control needs liquid or foam level, and test the candidate radar across the expected conditions. An unverified 100 mm offset can affect pump switching and must not be dismissed automatically.
FAQ
Q1. Can radar measure through foam?
Sometimes. Confirm whether the reported value follows the liquid, the foam top or another target during the most severe foaming conditions. A clear-water test cannot establish this. Record foam behavior, an independent liquid reference and loss-of-echo handling before accepting the configuration for inventory or control.
Q2. Does 80 GHz see through foam better than 26 GHz?
Not universally. A narrower beam can help avoid walls and internals, but transmission through foam depends on its properties and the whole radar design. Compare suitable candidate instruments on the actual liquid and foam, including deposits after repeated batches, rather than selecting by carrier frequency alone.
Q3. What is the typical error caused by foam?
There is no universal value or direction. The instrument may follow foam, continue tracking liquid, switch targets or enter its configured fault state. Measure the difference from an independent reference throughout the process cycle; do not apply a fixed offset to a changing foam layer.
Q4. Is ultrasonic better in foam?
Ultrasound may also be attenuated or reflected by foam. Its gas path adds temperature and composition constraints. If it is a candidate, test the required liquid or foam target under operating conditions and check maximum-level clearance. Neither an ultrasonic nor radar label establishes suitability by itself.
Q5. Can I use a float or displacer instead?
A buoyancy-based instrument may be a candidate, but its response depends on liquid and foam density, float or displacer design, turbulence and deposits. Verify free movement and the intended switching or measuring point. Do not assume that every float ignores foam or that a guided-wave replacement is automatically compatible.
Describe the foam thickness and behaviour, liquid properties, temperature and whether the process requires liquid or foam level. Get a foam assessment
Related reading: Level Measurement Technology Comparison: Radar vs Ultrasonic vs Guided Wave | Radar Level Measurement in Steam, Dust and Condensation: What Actually Works