Chinese
 Spanish
 Russian
 Portuguese
 French
 German
 Indonesian
 Thai
 Vietnamese
 Arabic
 Italian
 Turkish
 Polish
 Japanese


Silo inventory from radar level is an estimate assembled from several inputs, not a direct weight measurement. The radar observes a region of the surface; software must infer occupied volume and apply an appropriate bulk density before displaying tonnes.
Keep the Four Inputs Visible
| Input | Uncertainty source | Evidence to retain |
|---|---|---|
| Distance | Target selection, reference position and installation effects. | Raw reading, diagnostics and independent surface checks. |
| Pile profile | Filling peaks, discharge valleys and asymmetric material distribution. | Inlet and outlet arrangement plus observations through operating cycles. |
| Vessel volume | Hopper transitions, internal displacement and obsolete geometry. | As-built dimensions and the controlled conversion model. |
| Bulk density | Grade, moisture, aeration and compaction. | Sampling method, material identity and the conditions represented. |
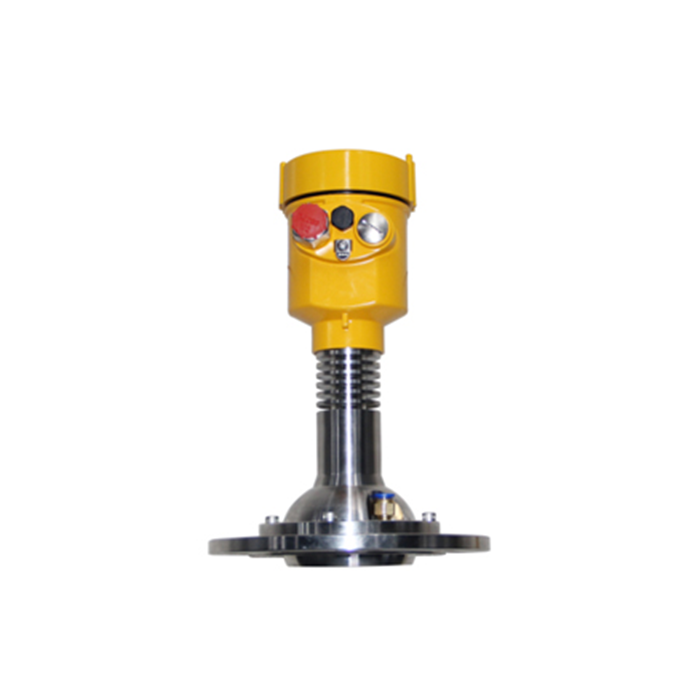
The MV-RD21 lists a nominal distance accuracy of +/-5 mm. That is not a promise of silo mass accuracy. A precisely measured pile peak can still be a poor basis for average occupied volume.
Silo Inventory From Radar Level Must Respect Mass Balance
For a stated volume V and representative bulk density rho, estimated mass is V multiplied by rho. If density is only known within a defensible interval, calculate the corresponding mass interval and separately acknowledge uncertainty in V. Do not label that interval a complete confidence bound unless the other errors have also been assessed.
During settling with no material transfer or other mass change, occupied volume can decrease while bulk density rises; total mass remains the same. The level at one observed point may also change differently from the average surface. If displayed tonnes change during that period, investigate the estimation model rather than claiming that compaction created additional material.
Reconcile Over Matching Time Windows
Compare opening inventory plus measured receipts minus measured withdrawals with the closing estimate. Align timestamps and material codes, and account for material still in conveying equipment. A late delivery entry can resemble a sensor error if transaction timing is ignored.
Group discrepancies by filling, settling and discharge state. Bias associated with one product may indicate a density assumption; error near a hopper transition may indicate geometry; jumps during delivery may indicate echo selection. Do not adjust one radar offset to force every category of discrepancy to disappear.
Choose the Measurement Architecture From the Required Decision
For refill scheduling, a validated single-point trend may be sufficient. For tighter reconciliation, assess whether additional surface information or an independent weighing system is required. Adding more decimal places to the display does not reduce uncertainty.
Keep high-level protection separate from inventory estimation. A mass calculation can be wrong while a local high-level condition is real, and a changing density factor must not redefine a protective setpoint without review.
Inventory Questions
Q1. Can a supplier's loose bulk density be used unchanged?
Only if its test condition represents the material in the silo closely enough for the required decision. Pneumatic filling, moisture and storage time can make that assumption unsuitable; document verification rather than silently tuning the factor.
Q2. When is one radar no longer sufficient?
When plausible pile profiles at the measured point produce inventory differences larger than the project can accept. Review additional measurement or weighing options using reconciliation evidence, not the radar's distance resolution alone.
Summary
Make the inventory estimate traceable from distance through geometry and density. Request an inventory-method review with silo drawings and matched receipt and withdrawal records.