Chinese
 Spanish
 Russian
 Portuguese
 French
 German
 Indonesian
 Thai
 Vietnamese
 Arabic
 Italian
 Turkish
 Polish
 Japanese

Open-channel flow is never measured directly at the sensor. A stage (head) reading at a weir or flume is converted to discharge with a power-law rating, and that conversion magnifies any head error by the exponent of the law. Add a telemetry layer that samples at a fixed interval and buffers through outages, and the same head error also distorts the accumulated volume. This article quantifies both effects and sets the sensor accuracy and sampling interval a duty actually needs.
Why open-channel flow starts with a stage reading
A weir or flume constrains the channel so that discharge becomes a single-valued function of the upstream head, measured from the crest or throat. The sensor therefore reports a water level, not a flow, and a separate rating equation does the conversion. A radar water level sensor is well suited here because it measures from above the flow with no contact, no stilling well and a typical range up to 70 m, and it is unaffected by the sludge, weeds and floating debris that block contact methods. The discharge rating, however, is fixed by civil works: a rectangular weir, a V-notch or a Parshall flume each has its own coefficient and exponent. The sensor accuracy you need is set by the rating, not by the sensor catalogue, because a small head error is about to be multiplied.
The rating holds only inside the structure's hydraulic envelope. A Parshall flume stops acting as a single control section above about 60 % submergence, and a sharp-crested weir needs a ventilated nappe, at least 0.03 m of head and a head-to-crest ratio below roughly 0.4. Outside those limits the tabulated coefficient does not apply and discharge can be 10–30 % wrong with a perfect level reading. A silted approach section biases the head as well.
The exponent that turns head error into flow error
For a sharp-crested rectangular weir the discharge follows Q = C · L · H^1.5, where H is the head above the crest, L is the crest length and C is a coefficient near 1.84 in SI units. The exponent 1.5 means a fractional error in H becomes 1.5 times that fraction in Q, and flumes run with exponents from about 1.6 to 2.0, which amplify even more. The table below is a worked rating at one site, computed from assumed dimensions, and is an illustrative calculation based on assumed site values rather than a calibrated field curve.
| Head H (m) | Q = 1.84 × 1.0 × H^1.5 (m³/s), L = 1.0 m | Note |
|---|---|---|
| 0.100 | 0.0582 | low flow |
| 0.200 | 0.1646 | mid flow |
| 0.300 | 0.3023 | |
| 0.400 | 0.4655 | high flow |
| 0.500 | 0.6505 | near capacity |
The rating is steep: between 0.20 m and 0.50 m the discharge rises almost fourfold (3.95×) for a 2.5-fold head change, which is exactly why head accuracy dominates the whole measurement.
Worked head-error amplification example
Take the mid-flow point H = 0.200 m, where Q = 0.1646 m³/s. Suppose the level sensor has a head uncertainty of ±0.005 m, a 2.5 % error in H. Raising the head to 0.205 m gives Q = 1.84 · 0.205^1.5 = 0.1709 m³/s, an increase of +3.8 %. Lowering it to 0.195 m gives Q = 0.1584 m³/s, a decrease of −3.8 %. Input (±0.005 m head) → conversion (power law, n = 1.5) → result (±3.8 % flow). Boundary condition: the same ±0.005 m at H = 0.100 m is a ±5.0 % head error and therefore about ±7.5 % flow, so head error hurts more at low flow where the exponent acts on a smaller number. A site that needs ±5 % flow at 0.2 m head allows about ±0.007 m of head uncertainty (±0.003 m if the same ±5 % must hold down to 0.1 m); a resolution figure alone does not prove that accuracy.
Independent head errors combine in quadrature. At H = 0.200 m, a ±3 mm sensor, ±2 mm datum and ±2 mm ripple give a root-sum-square of 4.1 mm, or 2.1 % of head, which becomes 3.1 % of flow at n = 1.5. Input (three ±mm terms) → conversion (root-sum-square, then power law) → result (±3.1 % flow). Boundary: a datum 10 mm low swamps the other terms and must be removed by survey.
Sampling interval and the peak you might miss
A level sensor samples at a fixed interval, and a fast stage rise can pass between two samples. Assume a storm raises the head linearly from 0.20 m to 0.55 m over a 12-minute window, peaking at t = 12 min. With a 5-minute interval the grid catches 0.20 m at t = 0, 0.346 m at t = 5 and 0.492 m at t = 10, and no sample lands on the 0.55 m peak, which is missed by 0.058 m. At that head the missed flow is roughly 1.84 × 1.0 × (0.55^1.5 − 0.492^1.5) ≈ 0.12 m³/s, a peak under-report. Input (rise rate ≈ 0.029 m/min) → conversion (interval × rate) → result (missed head). Boundary: if the head tolerance is 0.005 m, the interval must stay below about 0.17 min, or roughly 10 s, which only a fast RTU or logger achieves; a 1-minute scan is adequate for slowly varying irrigation flow but not for flash floods.
Totalization error from missing or late samples
Accumulated volume is the integral of discharge over time, so any gap or wrong hold value during an outage biases the total. Take one hour with a true mean Q of 0.150 m³/s, giving 540 m³. The 50 min outside the gap averaged 0.155 m³/s, so the hour still averages 0.150. If a 10-minute telemetry outage occurs and the logger holds the last good value of 0.120 m³/s, the reported volume is (3000 s · 0.155) + (600 s · 0.120) = 537 m³, a −0.6 % error. If the system instead reports zero during the gap, the total falls to 465 m³, a −13.9 % error. Input (gap length and hold behaviour) → conversion (Q · Δt summed) → result (volume bias). Boundary: the error scales with both gap duration and how far the hold value sits from the true flow, so buffered store-and-forward and a sensible hold or linear extrapolation must be specified in the acceptance test.
Telemetry gaps, buffering and time order after outage
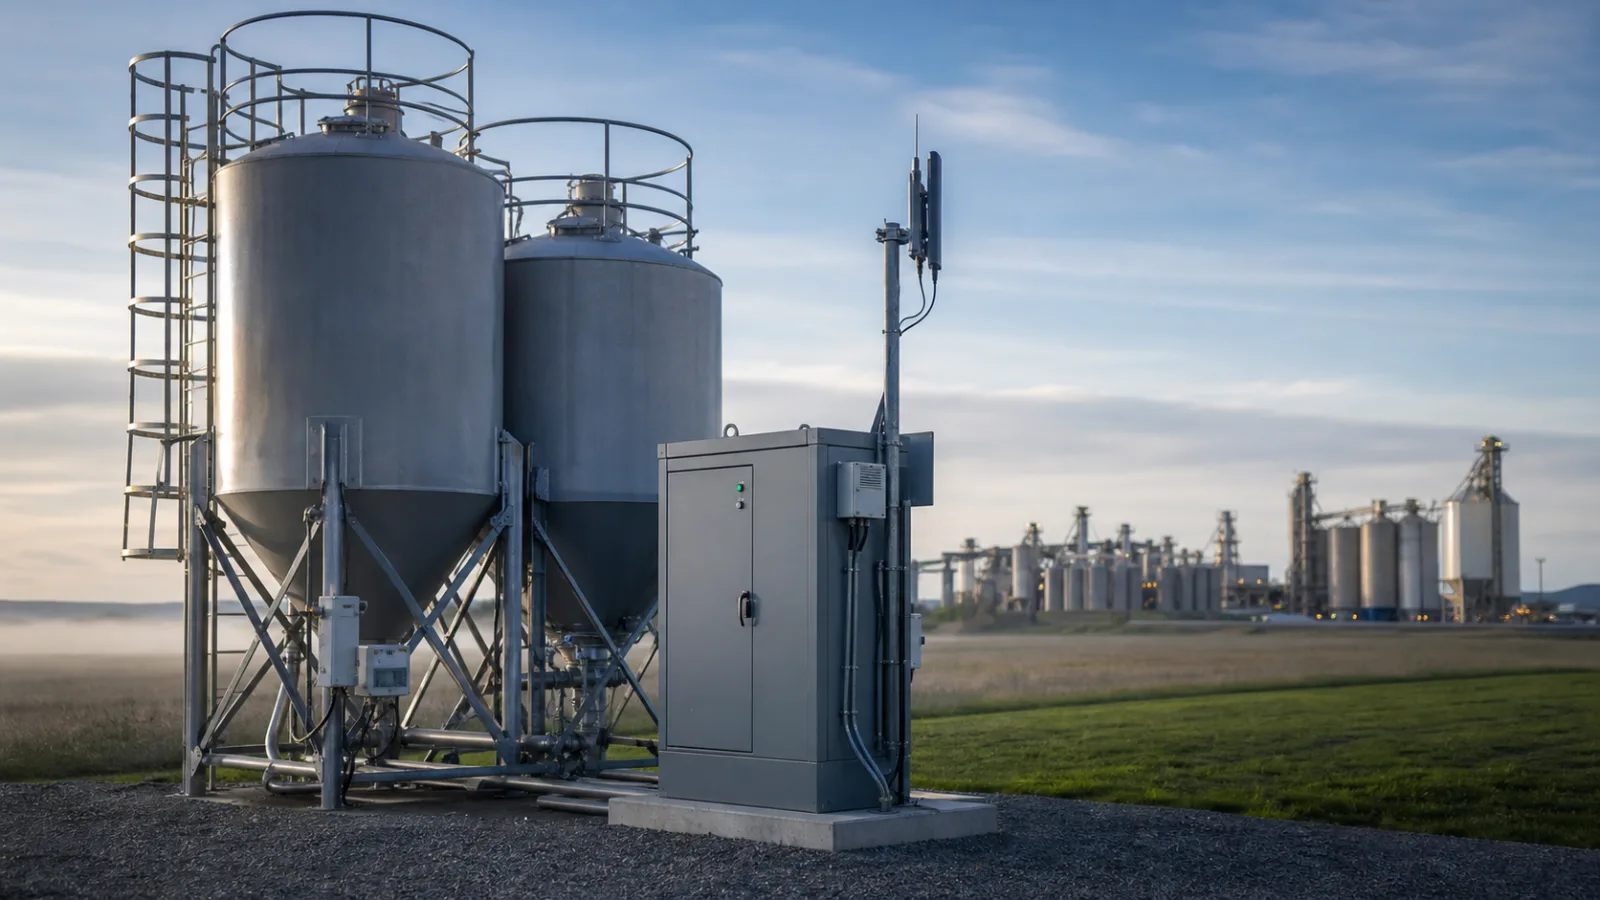
A water level RTU collects the head and passes it to a centre over 4G, LoRa or satellite, and during a network outage it should hold samples in local memory with correct timestamps. The failure mode to avoid is samples arriving out of time order after recovery, which corrupts any totalization done at the centre. A good RTU stamps each sample at acquisition, buffers for the expected maximum outage of perhaps 24 h at 1-minute logging, and replays in order on reconnection. Size the battery for three dark days so the sampling interval is not relaxed to save power — a longer interval reintroduces the peak error above. The acceptance check should include a simulated outage with a known stage profile and confirm that the replayed record reconstructs the volume within the stated tolerance. Where the civil works themselves are wrong — an uncalibrated crest, a fouled throat or an irregular channel with no single control section — no sensor accuracy or logging rate will save the discharge figure, and the open-channel method should be rejected until the structure is corrected and re-rated.
FAQ
Q1. Why does a small head error matter so much in open-channel flow?
Because discharge follows a power law in head, typically Q proportional to H^1.5 for a weir, so a fractional head error becomes 1.5 times that fraction in flow. A ±2.5 % head error at a rectangular weir becomes about ±3.8 % flow. At low head the same absolute error is a larger fraction, so the amplification is worse near the crest.
Q2. What sensor accuracy do I need for open-channel flow?
Set the needed head accuracy from the flow tolerance and the exponent, not from the sensor catalogue. If you require ±5 % flow at mid range with n = 1.5, the head accuracy should be near ±0.007 m at 0.2 m head, or ±0.003 m if the same ±5 % must hold down to 0.1 m. A radar sensor with resolution well under that, mounted clear of the downstream jet, is a common choice for the stage reading.
Q3. How does sampling interval affect the measured peak?
A fast stage rise can pass between samples, so a 5-minute interval may miss a flash-flood peak that a 1-minute or faster logger would catch. If the rise rate times the interval exceeds your head tolerance, shorten the interval or accept a peak under-report and document it in the data-quality notes.
Q4. What happens to totalized volume during a telemetry outage?
If the logger holds the last good value, the volume error is small and scales with gap length; if it reports zero, the error can exceed 10 %. Buffered store-and-forward with correct timestamps and a defined hold or extrapolation behaviour is the remedy, and it must be verified during acceptance.
Q5. Should the weir or the sensor decide the accuracy?
The civil rating decides. The weir or flume coefficient and exponent set how head error becomes flow error, and an incorrectly sized or fouled structure dominates the uncertainty. Verify the structure dimensions and keep the crest clear of debris before blaming the sensor for flow scatter.
Q6. Is solar power reliable for an unmanned flow station?
Yes if sized for the worst case: allow for three consecutive cloudy days at the site latitude, size the panel and battery for the logger and modem load, and confirm the charge controller holds the RTU through the longest expected dark period. An under-sized battery is the usual cause of data gaps during multi-day storms.
SUMMARY
Open-channel flow converts a head reading with a power law, so a ±0.005 m head error at mid range became ±3.8 % flow in the worked weir example, and a 10-minute outage holding zero cut the hourly volume by 13.9 %. Next, send us the structure type, crest dimensions and required flow tolerance, and our engineers will size the head sensor accuracy and the RTU sampling interval for your site.
Talk to a METRAVON engineer about this application
When you are specifying a weir or flume station, send us the structure drawing, the expected head range and the flow tolerance your report needs. Our engineers will work out the head-sensor accuracy and the logging interval that keep the discharge and totalized volume inside your limits.