Chinese
 Spanish
 Russian
 Portuguese
 French
 German
 Indonesian
 Thai
 Vietnamese
 Arabic
 Italian
 Turkish
 Polish
 Japanese

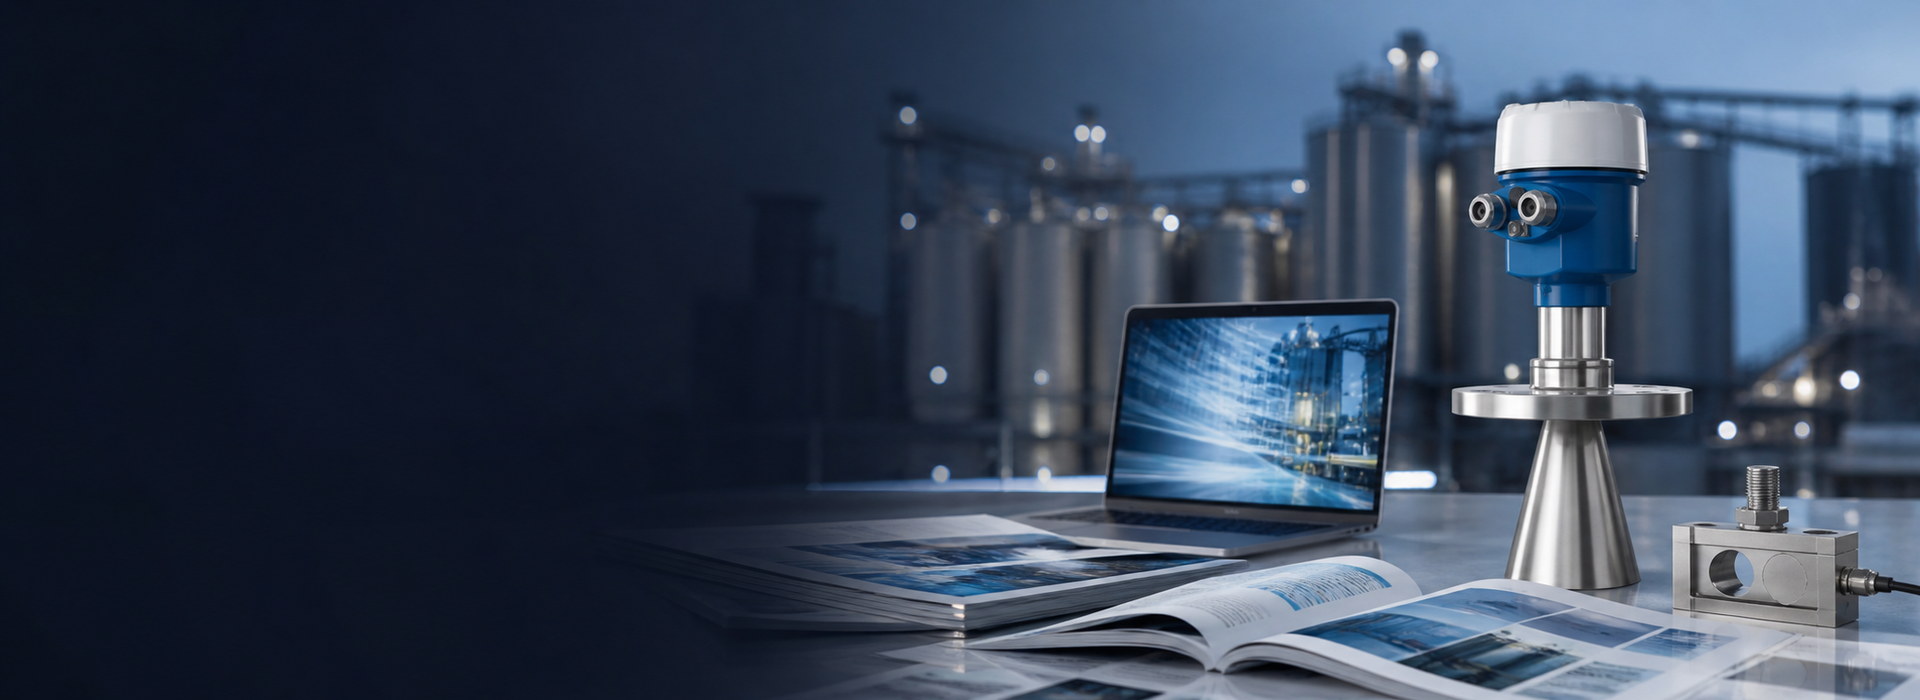
Oil Water Interface Level Measurement: Finding the Boundary, Not Just an Echo
Field rule. Oil water interface level measurement requires two answers: where is the top surface, and where is the oil–water boundary? A non-contact radar normally measures the upper liquid surface, not the interface beneath it. Guided-wave radar can often measure both when the dielectric contrast, upper-layer thickness and probe conditions suit the application. An emulsion layer can turn a theoretically clean boundary into a transition zone that no instrument should pretend is a single sharp line.
Draw the measurement before choosing the instrument
Sketch the vessel from the nozzle to the bottom and label total level, interface level, oil thickness, water withdrawal point, overflow and the expected emulsion region. Add normal and upset temperatures, density ranges and any solids. This sketch exposes contradictions such as an interface setpoint below a probe’s measurable zone or an oil layer thinner than the device requires.
| Process condition | Measurement implication | What to verify |
|---|---|---|
| Clean hydrocarbon over conductive water | Often favorable for guided-wave interface measurement | Dielectric values and minimum upper-layer thickness |
| Light oil over water with surfactants | Emulsion may be stable and thick | Boundary definition and sample results |
| Very thin oil layer | Interface echo may not be separable | Model-specific minimum thickness |
| Water or solids coating the probe | Signal and response may change | Cleaning, material and diagnostic strategy |
| Large density changes | Pressure-based calculations shift | Actual density at operating conditions |
| Only total level required | Interface capability may be unnecessary | Avoid paying for an unused second channel |
Why guided-wave radar can return two levels
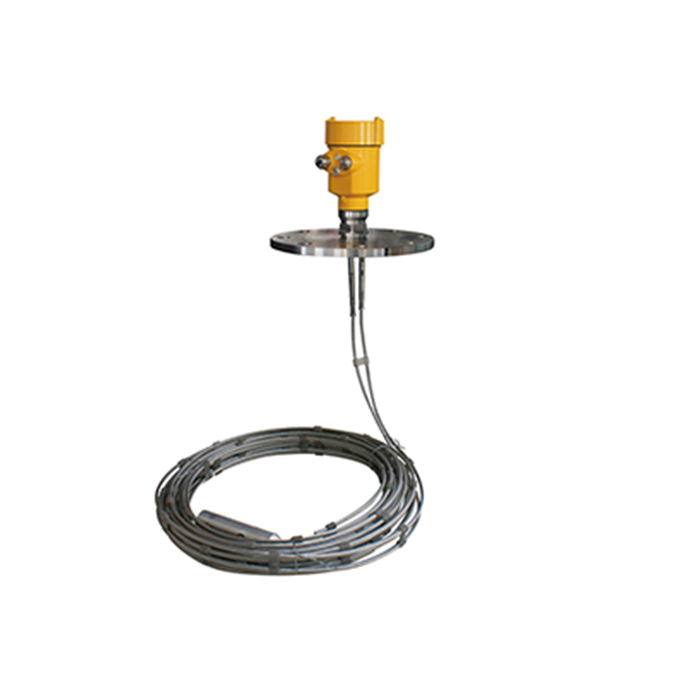
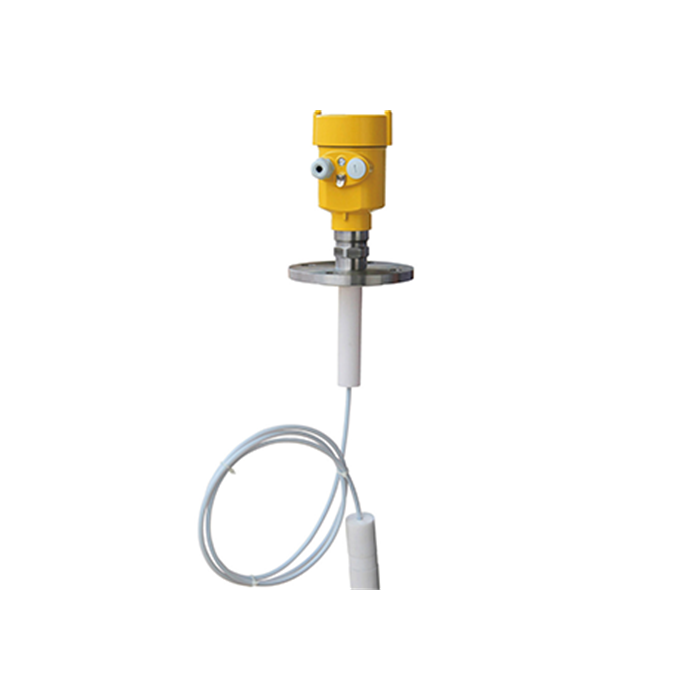
A guided electromagnetic pulse travels along the probe. Part of the energy can reflect at the upper product surface; the remainder can continue and reflect at a lower boundary with a sufficiently different dielectric constant. The device evaluates these reflections to report top level and interface.
This is not the same as looking through oil with a free-space radar beam. Nor is it a guarantee that every two-liquid system produces two stable echoes. The upper liquid affects transmission, the probe must be suitable for both products, and the lower boundary must be sufficiently defined.
Specify the required outputs explicitly. For example, PV = total level from the reference, SV = interface level from the same datum. Do not accept a drawing that labels one output “level” and the other “interface” without defining whether either is a distance, a height above the bottom, or a percentage of span.
Worked separator logic
Consider a separator with a 2.40 m normal total level and a 1.75 m interface level, both measured above the vessel bottom. Oil thickness is:
2.40 − 1.75 = 0.65 m
If the control philosophy requires at least 0.45 m of oil above the interface, the interface must not rise above 1.95 m while total level remains 2.40 m. But if total level changes, a fixed oil-thickness calculation must use both measurements. Controlling interface from total level alone is wrong.
Now suppose the operator reports oil in the water outlet. A changing interface, withdrawal arrangement, emulsion carry-under or an incorrect measurement may each be involved. Use approved sampling or another validated reference under the site safety procedure before changing the transmitter threshold or control action.
Verification should use the process, not only a simulator
A HART or current simulation verifies that two output channels reach the control system. It does not prove that the instrument detects a physical interface. During commissioning, compare total and interface readings against independent observations at available sample taps or another validated reference. Record the oil thickness as well as the two absolute levels; an error shared by both channels can disappear when only thickness is reviewed, while opposite errors can double.
If the process cannot provide safe, known interface conditions during commissioning, state that limitation in the handover. Do not sign an interface-accuracy test that was never performed.
Give operations a two-channel alarm philosophy
A high interface alarm, low total level alarm and low oil-thickness calculation do not mean the same thing. Write the required response beside each and verify it against the separator design and failure scenarios. The direction of a water-withdrawal adjustment cannot be prescribed from a generic alarm label; it belongs to the process cause-and-effect design.
If oil thickness is calculated in the PLC, subtract the two levels only after confirming that both use the same datum and units. Add a quality check: when either channel is bad, the calculated thickness must be marked bad rather than frozen as a believable number. Trend total level, interface and thickness together; a thickness trend by itself hides which measurement moved.
What to do about an emulsion or rag layer
First define what the control system needs: top of the emulsion, bottom of the emulsion, a conductivity transition, or an operational withdrawal limit. These can be metres apart. A single “interface” value may not represent any of them reliably.
Use process sampling to understand the layer’s thickness and variability. Sometimes better separation, temperature control, chemical treatment or a changed withdrawal strategy creates more value than another instrument. In severe service, a second measurement principle may help interpretation, but two uncertain numbers do not automatically create certainty.
Questions from separator projects
Q1. Can non-contact radar measure oil–water interface directly?
Usually it measures the upper surface. Interface measurement beneath a liquid normally needs a suitable guided-wave or another application-specific technology.
Q2. Is guided-wave radar always the best choice?
No. Probe coating, emulsion, very thin upper layers, mechanical forces and vessel internals can make it unsuitable. Selection starts with the phase behavior and mechanical design.
Q3. Why is the interface reading stable but wrong?
A threshold or tracking setting may be holding a preferred echo, or the probe may be coated. Stable does not mean correct; compare with physical samples and echo diagnostics.
Q4. Can density be used to calculate interface from pressure?
Only with suitable pressure taps and known phase densities. Changing oil composition, temperature and emulsion make the calculation uncertain, and the taps may plug.
Q5. What data should be on the RFQ?
Both liquid identities and dielectric information where available, density and temperature ranges, expected oil thickness, emulsion behavior, vessel and nozzle dimensions, probe clearance, required outputs and the control purpose.